Introduction
In the dynamic world of trading, recognizing early trend reversals can lead to highly profitable opportunities. One such vital signal is the Bullish engulfing candlestick pattern—a two-candle formation that suggests a shift from bearish control to bullish strength. Found at the bottom of a downtrend, this pattern is favored by traders for its reliability in predicting upward price movements.
The bullish engulfing pattern not only highlights a change in market sentiment but also offers traders a potential entry point backed by clear price action. In this guide, we’ll explore what the bullish engulfing candlestick looks like, why it forms, and how you can use it to fine-tune your trading decisions.
What is the Bullish Engulfing Candlestick?
The Bullish Engulfing candlestick is a two-candle formation that appears at the end of a downtrend. It signals a possible reversal in price from bearish to bullish, providing traders with opportunities to buy into the market at favorable prices.
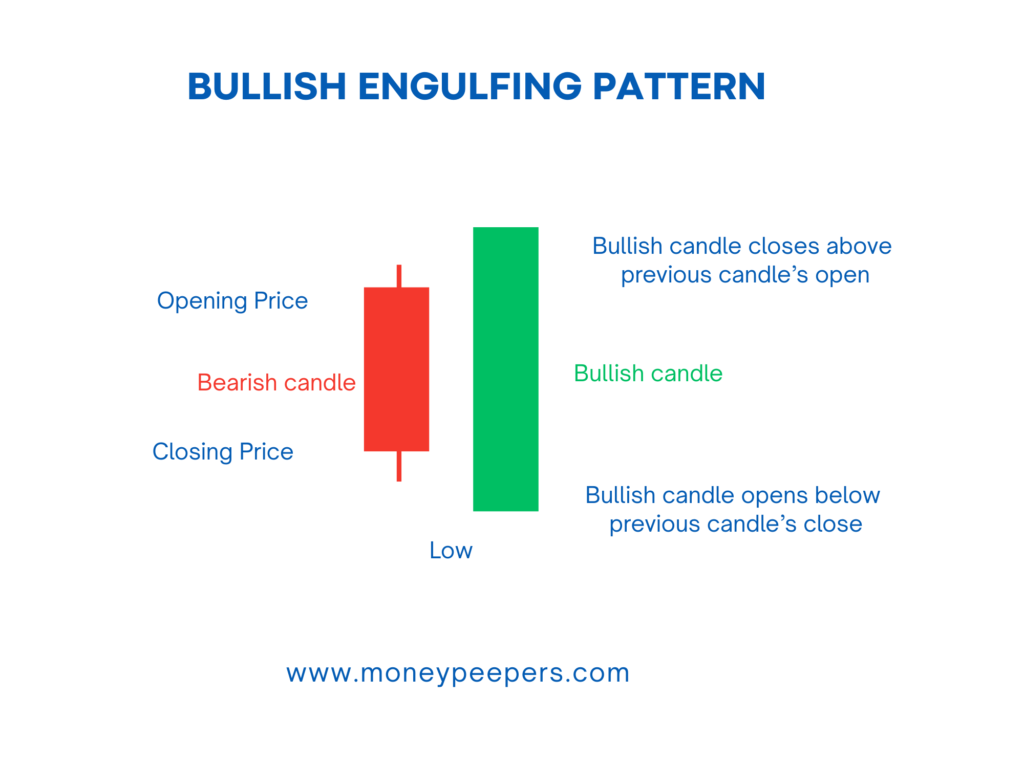
Visual Description and Components:
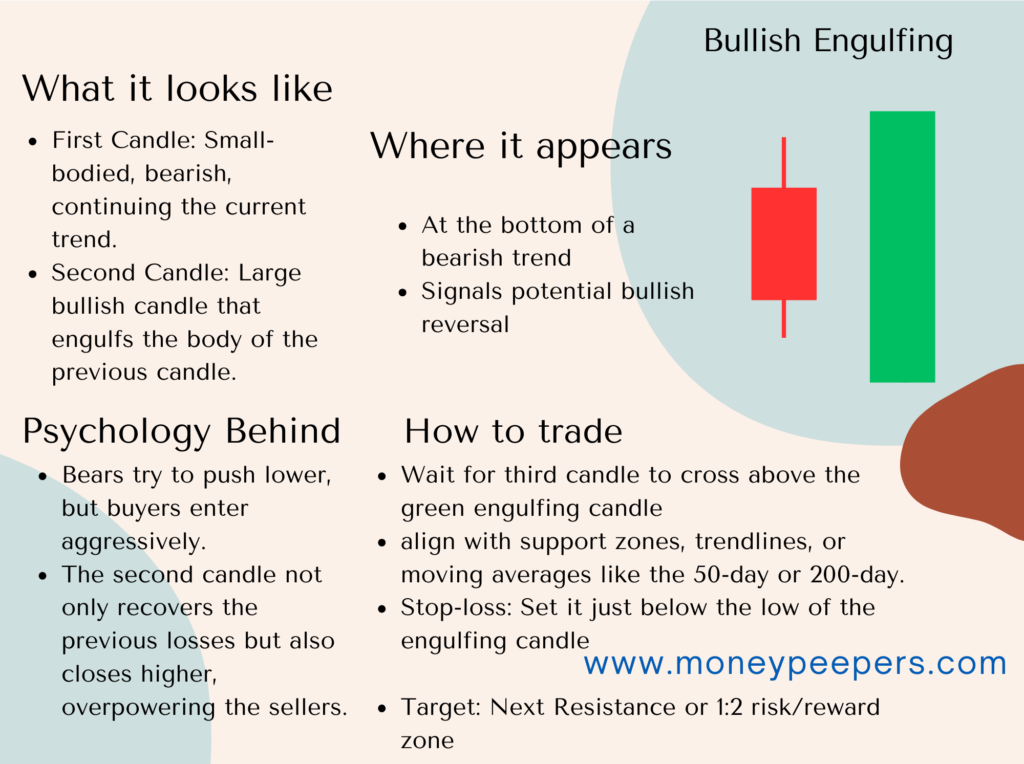
- First Candle (Bearish): Typically smaller and bearish (red or black), indicating a continuation of the downtrend.
- Second Candle (Bullish): A large bullish candle (green or white) whose real body fully engulfs the real body of the preceding bearish candle.
This structure symbolizes strong buying momentum overtaking selling pressure, suggesting a potential end to the bearish trend and the beginning of an upward move.
Formation & Market Psychology Behind It
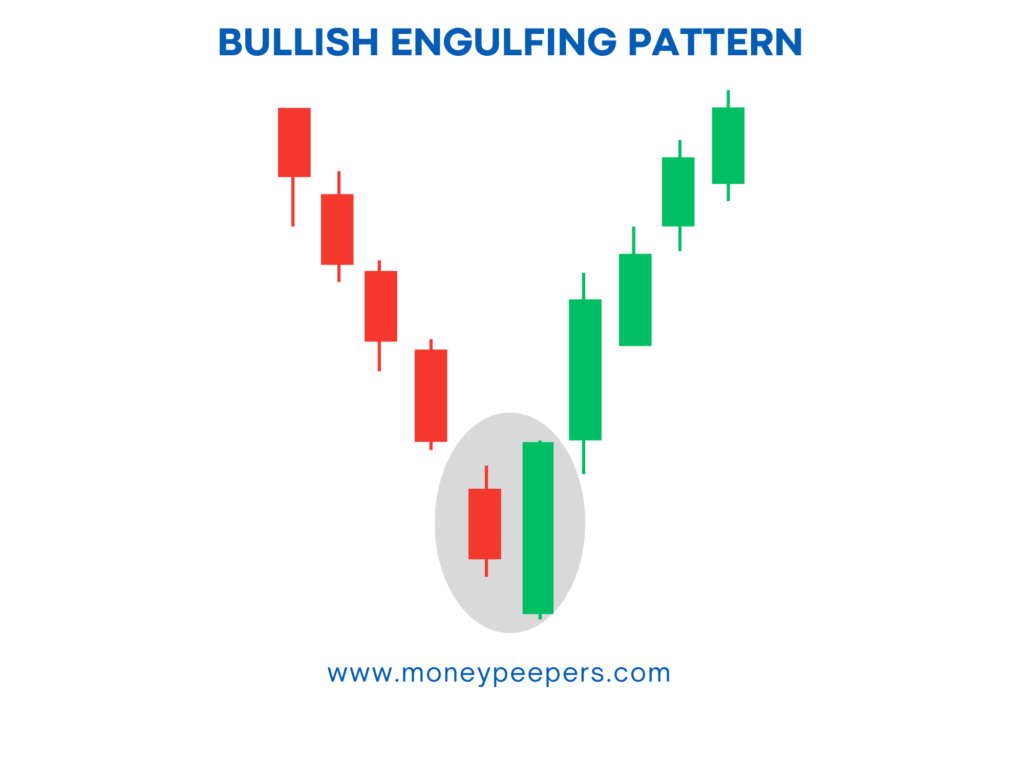
The formation of the Bullish Engulfing candlestick pattern occurs when the market initially continues in a downtrend with bearish sentiment prevailing. Sellers maintain control, pushing prices lower at the start of the trading session, as reflected by the first bearish candle. However, during the next session, strong buying interest emerges, pushing prices significantly higher, thus creating the second bullish candle.
The psychology behind this pattern indicates a powerful shift in trader sentiment. Initially dominated by sellers, the market quickly shifts as buyers enter aggressively, driving prices upward and overwhelming bearish sentiment. This momentum shift signals traders that bulls are regaining control, making it a prime entry point for long positions.
Real-World Example:
Consider a scenario where a particular stock has been declining for several sessions due to negative sentiment. Suddenly, positive news or favorable market conditions emerge, prompting significant buying interest. This scenario creates a large bullish candle that completely engulfs the preceding bearish candle, signaling a bullish reversal and attracting more buyers into the market.
Key Identification Criteria
To effectively recognize a Bullish Engulfing candlestick, traders should look for these specific characteristics:
- Occurs after a defined downtrend: Essential for pattern validity.
- Second candle completely engulfs the first candle: Real body of the bullish candle must fully cover the previous bearish candle’s body.
- Volume Increase: High trading volume on the bullish candle enhances reliability.
- Minimal Shadows: Ideally, minimal upper and lower shadows on the bullish candle signify strong buying pressure.
The Bullish Engulfing pattern should not be confused with similar patterns like the Hammer or Piercing Line, which also signal bullish reversals but have different structural criteria.
How to Confirm the Bullish Engulfing Candlestick Pattern
Confirmation strengthens the reliability of the Bullish Engulfing candlestick pattern:
- Next Candle Validation: A subsequent bullish candle closing above the engulfing candle’s high provides strong confirmation.
- Technical Indicators: Utilize indicators such as increased volume, RSI bullish divergence, MACD bullish crossover, or moving averages to further confirm the reversal.
For example, if the following session after a Bullish Engulfing formation shows strong bullish movement on elevated volume, this significantly reinforces the signal.
Trading Strategy Using the Bullish Engulfing Candlestick
Effective trading strategies involve clear entry points, stop-loss placement, and target profit strategies:
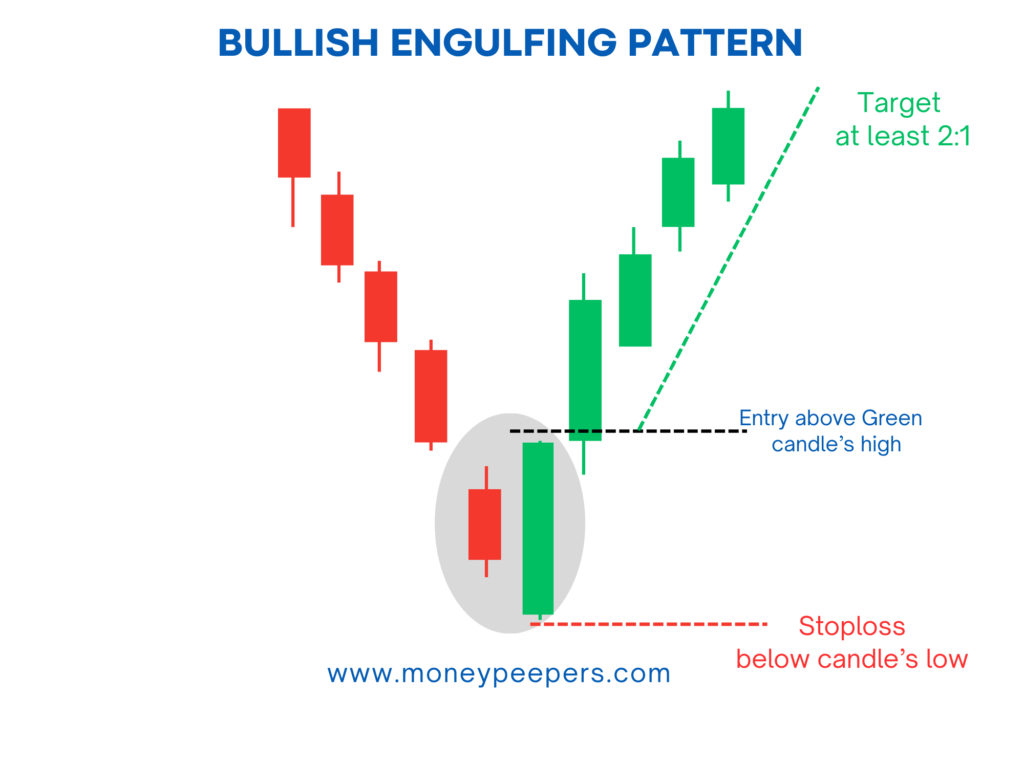
Entry Point:
Enter a long position once the next candle confirms bullish momentum, typically by closing above the Bullish Engulfing candle’s high.
Stop-loss Placement:
- Conservative: Set below the low of the Bullish Engulfing pattern.
- Aggressive: Position at the midpoint of the engulfing bullish candle.
Target/Exit Strategies:
Aim for previous resistance levels, Fibonacci retracements, or maintain at least a 1:2 risk-to-reward ratio to optimize profitability.
Position Sizing Tips:
Calculate positions carefully, considering personal risk tolerance and account size to ensure prudent risk management.
Chart Examples
For instance, examining a forex pair like EUR/USD after a significant downtrend reveals a Bullish Engulfing candlestick formation. Traders observing the subsequent bullish confirmation candle with increased volume enter a long position, placing their stop-loss below the pattern’s low and setting a profit target at a clear resistance level, resulting in a profitable trade.
When the Pattern Fails (Limitations & False Signals)
Despite its high reliability, the Bullish Engulfing pattern can sometimes produce false signals. Common reasons include:
- Weak Confirmation: Lack of strong follow-up candles.
- Low Volume: Insufficient trading activity reduces pattern reliability.
Tips to Avoid Traps:
- Ensure robust confirmation signals.
- Combine pattern recognition with additional technical analysis.
- Avoid relying solely on the Bullish Engulfing pattern in choppy or range-bound markets.
Best Timeframes and Markets to Use This Pattern
- Timeframes: Effective across multiple timeframes—intraday, daily, weekly—benefiting day traders, swing traders, and positional traders alike.
- Markets: Reliable in stocks, forex, cryptocurrencies, and commodities with clear trending behaviors.
- Trader Experience Level: Suitable for both novice and experienced traders, provided strong confirmations and risk management practices are employed.
Tips to Enhance Accuracy
Traders can significantly enhance the accuracy of the Bullish Engulfing pattern by:
- Combining it with trendlines, support/resistance levels, and volume analysis.
- Integrating complementary candlestick patterns and indicators such as RSI and MACD.
- Avoiding trading during low-volume or sideways market conditions.
Real Trading Example (Optional Case Study)
Imagine trading Apple Inc. (AAPL) stock after an extended downtrend. A Bullish Engulfing pattern appears at a key support level, confirmed by the next candle’s bullish close. Traders enter a long position, placing a stop-loss below the pattern’s low and targeting the next resistance level. This trade yields a favorable risk-to-reward outcome.
Conclusion
The bullish engulfing candlestick is more than just a visual pattern—it’s a reflection of shifting market sentiment and growing buying pressure. When spotted at the end of a downtrend and confirmed with volume or support zones, it can offer a high-probability entry signal for bullish trades.
However, like all technical tools, it works best when used in combination with other indicators and sound risk management. By mastering this powerful candlestick, you’ll be better equipped to catch early reversals and ride the wave of a new bullish trend with greater confidence.
Also Read : Shooting Star Candlestick: A Powerful Signal for Bearish Reversals
Do follow us at : https://x.com/MoneyPeepers