Introduction
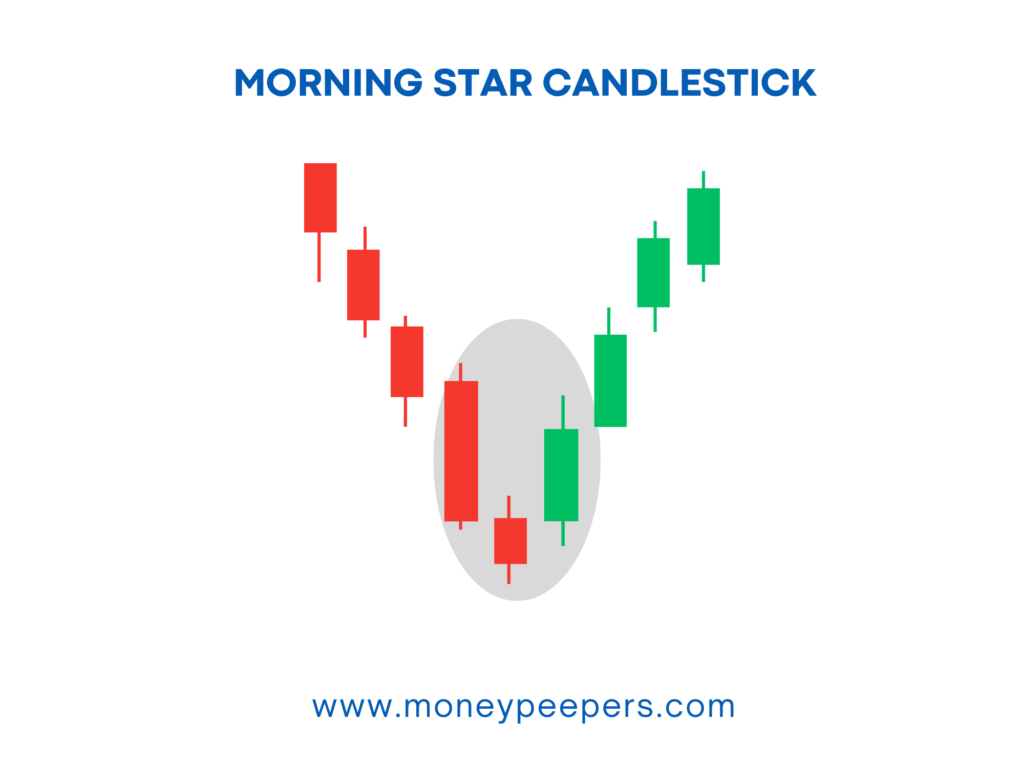
In the world of candlestick analysis, few patterns shine as clearly as the Morning Star when it comes to predicting bullish reversals. Appearing at the bottom of a downtrend, this three-candle formation tells a compelling story of shifting momentum—from bearish exhaustion to bullish control.
The Morning Star pattern is made up of a large bearish candle, followed by a small-bodied candle (which can be bullish or bearish), and finally, a strong bullish candle that closes deep into the first candle’s range. This combination signals that sellers are losing their grip and buyers are stepping in with strength. Traders often rely on this formation to anticipate upward price movements and position themselves for trend reversals.
What is the Morning Star Candlestick?
The Morning Star is a three-candle bullish reversal pattern typically appearing at the bottom of a downtrend. It suggests the weakening of bearish momentum and signals the possible emergence of bullish buyers entering the market.
Components and Visual Description:
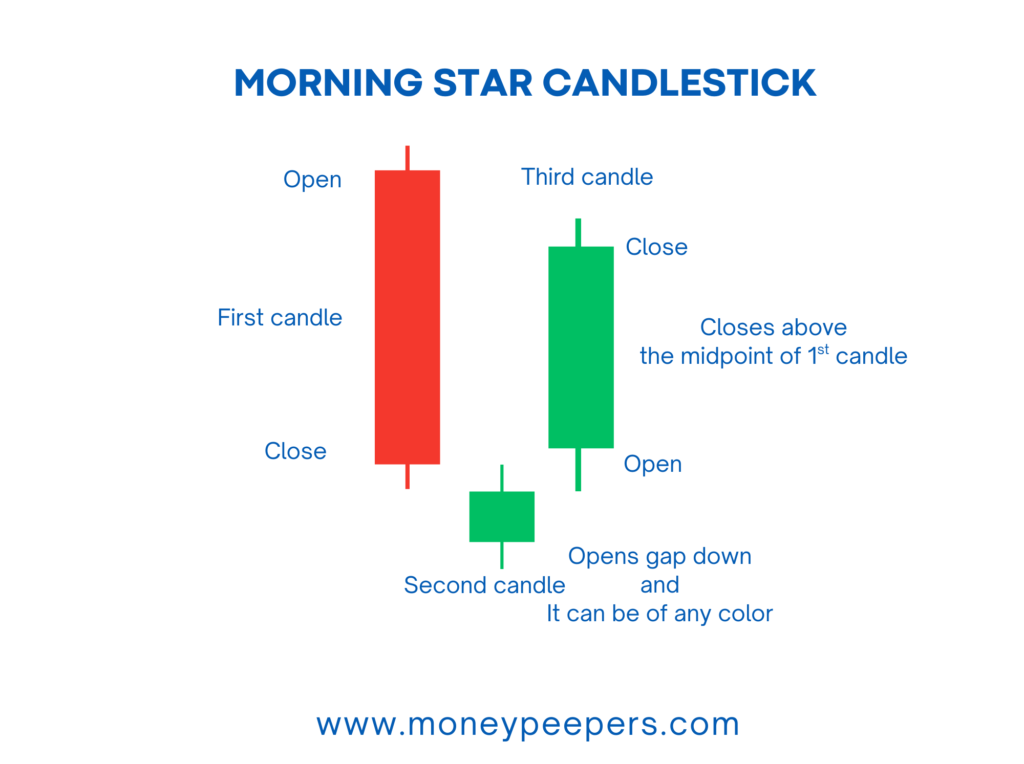
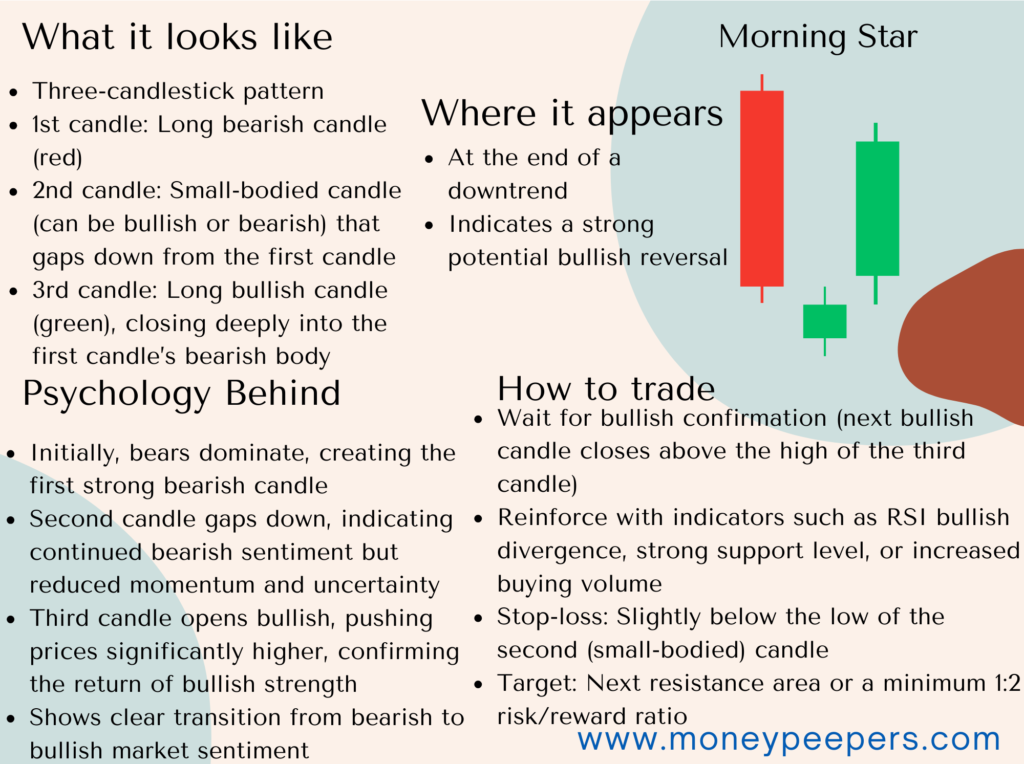
- First Candle (Bearish): A long bearish candle indicating strong selling pressure and the continuation of a downtrend.
- Second Candle (Star): A small-bodied candle (bullish or bearish), often gapping lower, symbolizing indecision between bulls and bears.
- Third Candle (Bullish): A large bullish candle closing well into the body of the first bearish candle, highlighting renewed buying momentum.
This three-candle formation visually portrays a market shift from bearish dominance to bullish optimism.
Formation & Market Psychology Behind It
The formation of the Morning Star pattern occurs following a sustained downward trend, where market sentiment is predominantly negative. Initially, bearish traders firmly control prices, driving them significantly lower, which forms the first large bearish candle. During the formation of the second candle, selling pressure diminishes, reflected by the smaller size and possible gap. This candle signifies indecision as neither buyers nor sellers dominate the session. In the subsequent session, bullish traders take control aggressively, driving prices upward significantly to close deep within the body of the initial bearish candle.
Psychologically, the pattern indicates an exhaustion of selling pressure and the emergence of bullish optimism. The transition from strong bearish sentiment to bullish buying interest signifies a key reversal point for traders.
Real-world Example:
Imagine a scenario where a particular stock has been declining consistently due to poor earnings results. Initially, investor sentiment is heavily bearish, causing prices to fall significantly. However, news of a strategic merger or improved financial guidance emerges, sparking uncertainty during the formation of the second small-bodied candle. The third candle shows bullish traders decisively entering the market, forming the Morning Star pattern and signaling traders to anticipate upward movement.
Key Identification Criteria
To correctly identify the Morning Star candlestick pattern, traders should look for these essential characteristics:
- Downtrend Context: The pattern should occur following a clear and prolonged downtrend.
- First Candle: A sizable bearish candle indicating continued bearish pressure.
- Second Candle (Star): Small body, ideally gapping lower from the first candle, indicating indecision.
- Third Candle: A strong bullish candle closing deeply into the first candle’s body, ideally beyond its midpoint.
This pattern contrasts clearly with the Evening Star pattern, which indicates bearish reversals at market tops.
How to Confirm the Pattern
For reliable trading signals, confirmation of the Morning Star pattern is crucial:
- Follow-up Bullish Candle: A bullish candle following the pattern and closing above the third candle’s high significantly strengthens the reversal signal.
- Technical Indicators: Increased trading volume, bullish divergence on the RSI indicator, bullish crossover on the MACD, or breaking above key moving averages provide additional confirmation.
For instance, observing a subsequent bullish candle on high volume further confirms the pattern’s bullish implications.
Trading Strategy Using the Morning Star Candlestick
An effective trading strategy involves clear entry and exit guidelines:
Entry Point:
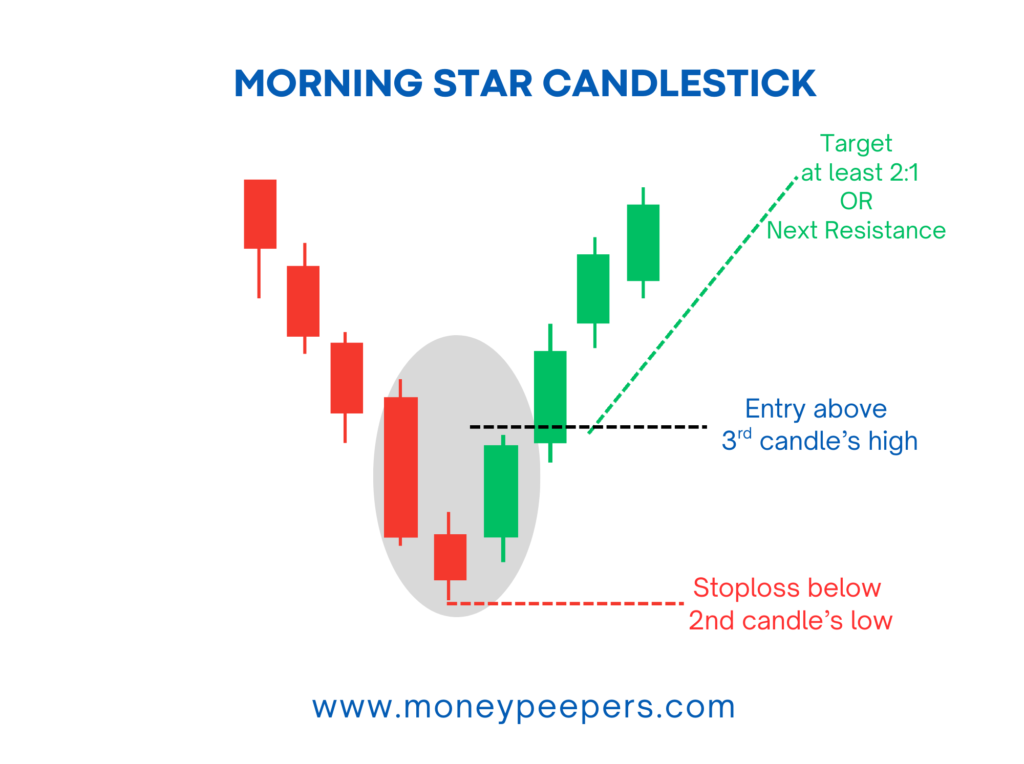
Enter long positions upon confirmation from the next bullish candle closing above the high of the Morning Star pattern.
Stop-loss Placement:
- Conservative: Place just below the lowest low of the star candle.
- Aggressive: Set stop-loss slightly below the low of the first bearish candle.
Target/Exit Strategies:
Target resistance levels, previous highs, or Fibonacci retracement levels while maintaining at least a 1:2 risk-reward ratio.
Position Sizing Tips:
Adjust your trade size based on risk tolerance, account size, and overall trading strategy to maintain disciplined risk management.
Chart Examples
Consider a currency pair, such as GBP/USD, in a prolonged downtrend. A Morning Star pattern forms near a historical support level. Upon bullish confirmation in the subsequent candle, traders initiate long positions, placing stop-losses below the pattern’s low and targeting resistance levels for profitable outcomes.
When the Pattern Fails (Limitations & False Signals)
Despite its reliability, the Morning Star can sometimes give false signals:
- Weak Follow-up Confirmation: Without a strong bullish confirmation candle, the reversal might not sustain.
- Low Trading Volume: Patterns formed during low-volume conditions may lack conviction, increasing false signal risks.
Tips to Avoid False Signals:
- Always wait for robust confirmation candles.
- Combine the Morning Star with other technical indicators.
- Avoid trading solely based on the pattern in uncertain or sideways market conditions.
Best Timeframes and Markets to Use This Pattern
- Timeframes: Effective on intraday, daily, or weekly charts, suitable for positional, swing, and intraday traders.
- Markets: Applicable across forex, stocks, commodities, and cryptocurrency markets, particularly in clear trending environments.
- Trader Suitability: Suitable for all traders, from beginners to seasoned professionals, when appropriate confirmation and risk management practices are employed.
Tips to Enhance Accuracy
Enhance trading reliability by:
- Combining the pattern with support and resistance levels, trendlines, and volume analysis.
- Using additional indicators like RSI, MACD, or moving averages to confirm signals.
- Avoiding low-volume and choppy market conditions.
Real Trading Example (Optional Case Study)
For instance, consider trading Tesla (TSLA) stock after a sustained decline. A Morning Star pattern emerges at a major support level. Confirmed by strong bullish follow-up, traders enter long positions, set stop-losses below the pattern’s low, and target resistance levels, resulting in a profitable trade.
Conclusion
The Morning Star candlestick pattern is more than just a visual formation—it’s a reflection of changing market psychology. It marks a potential turning point in a downtrend, giving traders a heads-up that bullish sentiment is gaining ground.
When supported by other technical indicators like volume spikes, support levels, or trendline breaks, the Morning Star becomes a highly reliable setup. Whether you’re looking to enter a new trade or time your exit from a short position, this pattern offers a valuable edge. It’s a signal worth watching—especially when the market needs a reason to rise.
Also Read : Mastering the Bearish Engulfing Candlestick Pattern: A Comprehensive Trading Guide
Follow US at X