Introduction
In trading, spotting a trend reversal before the crowd does can make all the difference. The Bearish Harami candlestick pattern is one of those early-warning signs that seasoned traders watch closely. It’s a two-candle formation that suggests bullish momentum might be slowing—and a potential downtrend could be around the corner.
The pattern forms when a large bullish candle is followed by a smaller bearish candle that fits entirely within the body of the previous candle. This visual shift reflects uncertainty and hesitation in the market, often seen at the top of an uptrend. While it may not guarantee a reversal on its own, the Bearish Harami becomes far more powerful when combined with other technical tools or resistance zones.
What is the Bearish Harami Candlestick?
The Bearish Harami candlestick is a two-candle pattern that signals potential bearish reversal. It typically occurs during an established uptrend, hinting at a slowdown in bullish momentum and a possible shift toward selling pressure.
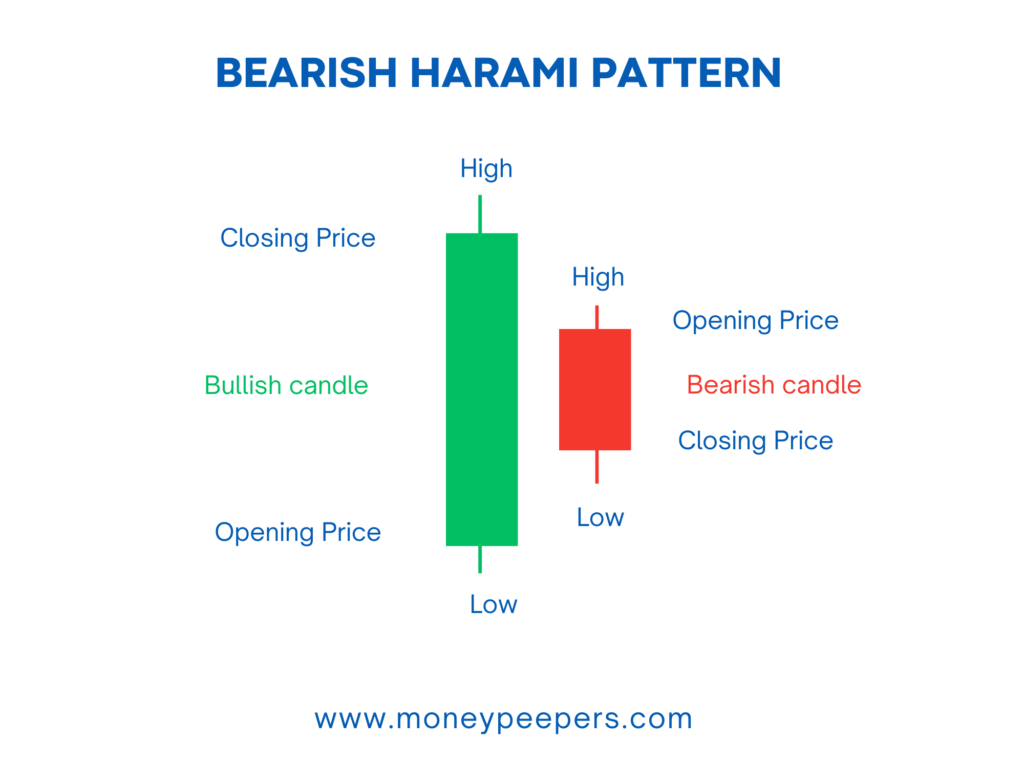
Visual Structure:
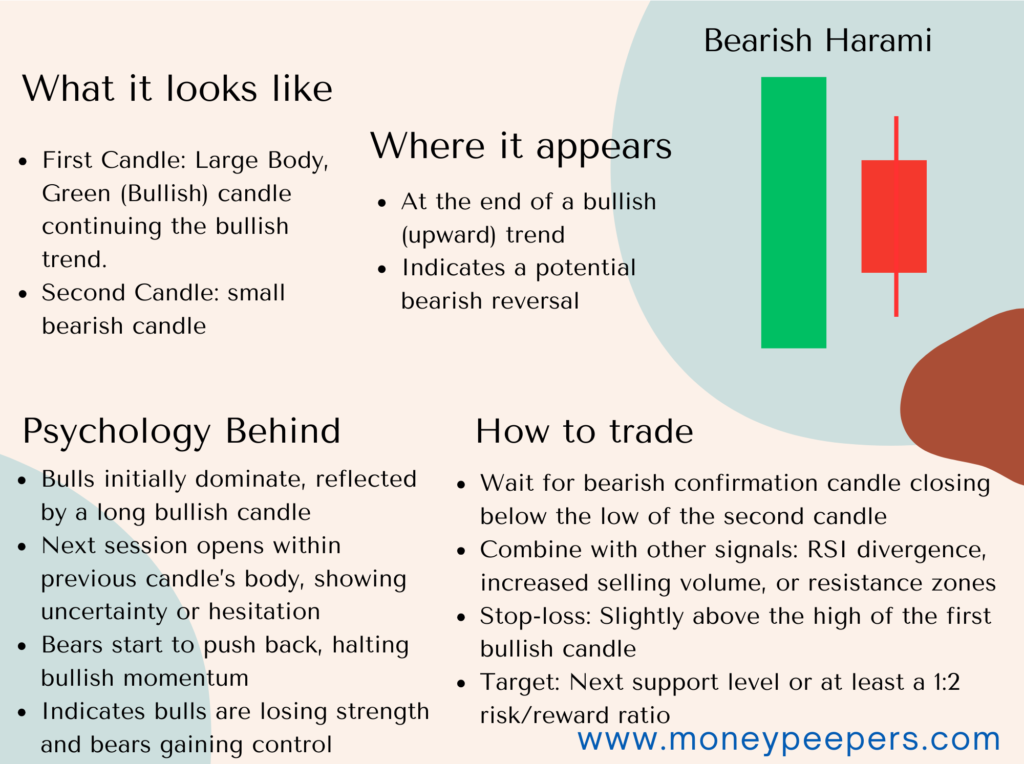
- First Candle (Bullish): A large-bodied green or white candle showing strong upward momentum.
- Second Candle (Bearish or Neutral): A smaller candle (red or black) that is completely contained within the real body of the previous bullish candle.
The visual metaphor of the Harami (meaning “pregnant” in Japanese) is evident—the smaller candle sits “inside” the larger one, representing a market pause and a potential reversal.
Formation & Market Psychology Behind It
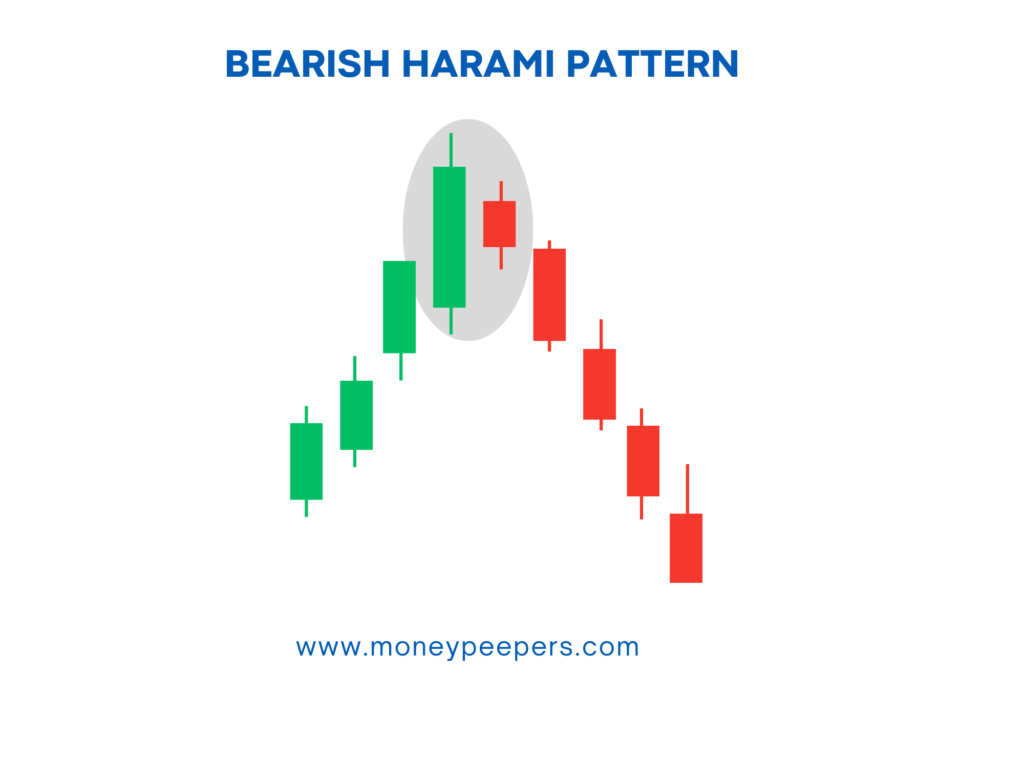
The Bearish Harami forms when a surge of bullish energy pushes prices higher (first candle), followed by a session of hesitation or mild selling pressure (second candle). The second candle, smaller and enclosed within the first, shows that buyers are losing momentum and bears may begin to take control.
This pattern reflects uncertainty at the top. Investors who were aggressively buying may now be reluctant to push prices higher. Sellers begin entering the market, creating a shift in balance and a potential top.
Real Market Sentiment Example:
Imagine a stock like Tesla (TSLA) in a strong uptrend due to favorable earnings. After several green sessions, a large bullish candle forms. The next day, despite bullish sentiment, the stock opens lower and trades within a narrow range, forming a smaller bearish candle inside the prior body. This combination creates the Bearish Harami pattern, signaling a possible end to the rally.
Key Identification Criteria
To ensure accurate recognition of the Bearish Harami, traders should look for:
- Trend Context: Must appear during a clear bullish trend.
- Candle Body Size: The first candle should be large and bullish.
- Second Candle: Smaller body, bearish or neutral, completely within the high-low range of the first candle’s body.
- Color: Second candle is typically red or black, but color is less critical than position.
Comparison:
Unlike the Bearish Engulfing pattern, where the second candle swallows the first, the Bearish Harami signals reversal through shrinking momentum, not dominance.
How to Confirm the Pattern
A Bearish Harami should be confirmed before trading:
- Next Candle: A strong bearish candle closing below the Harami’s second candle adds confirmation.
- Volume Spike: Increased volume on the confirmation candle boosts pattern reliability.
- RSI/MACD Signals: RSI showing overbought or MACD showing bearish divergence strengthens the reversal thesis.
Ideal Confirmation:
A bearish candle with high volume that closes below the Harami’s second candle.
Trading Strategy Using Bearish Harami
A structured trading plan around the Bearish Harami should include:
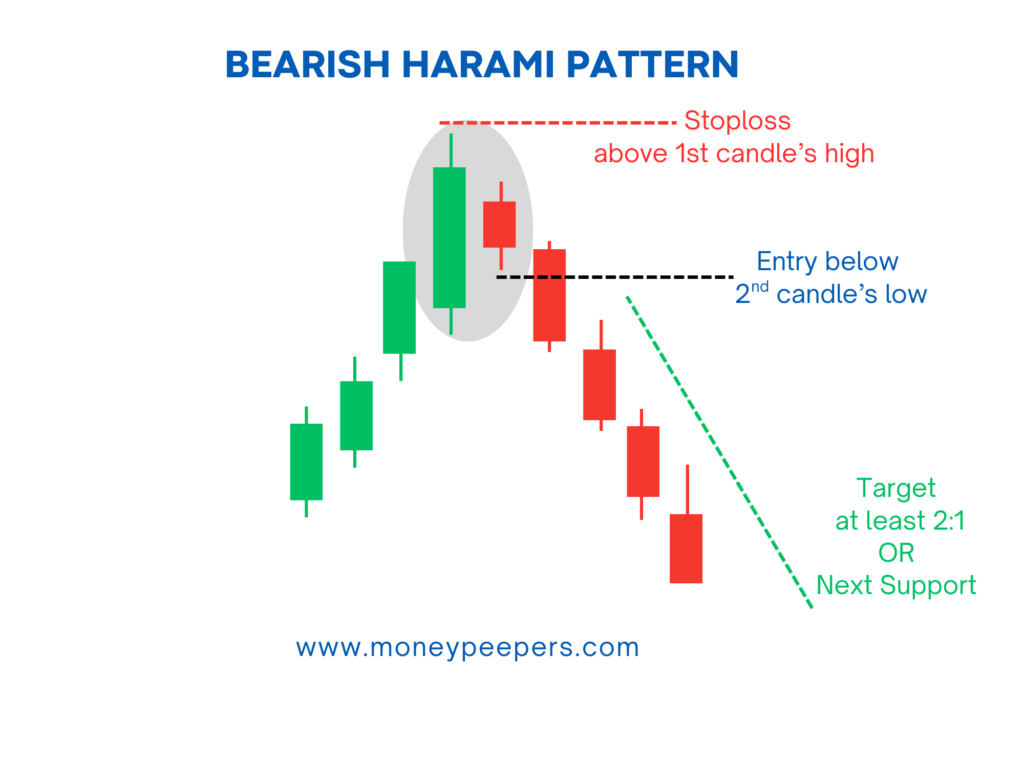
Entry Point:
Enter short on the break below the second candle’s low or after a confirmation bearish candle closes.
Stop-Loss Placement:
- Conservative: Above the high of the first candle.
- Aggressive: Above the high of the second candle.
Exit Strategy:
- Look for previous support or Fibonacci retracement levels.
- Maintain a risk-to-reward ratio of at least 1:2.
Position Sizing:
Adjust size according to account balance and risk appetite. Don’t risk more than 1-2% of your capital per trade.
Chart Example
Take Bitcoin (BTC/USD) after a strong rally. A long bullish daily candle forms. The next day, a smaller bearish candle forms inside it. The following day, a red candle breaks below the second candle. A short position is opened, stop-loss set above the high, and target set at a recent support. Trade ends in profit.
When the Pattern Fails (Limitations & False Signals)
Even strong patterns like Bearish Harami can fail:
Common Causes:
- Appears in choppy or sideways markets.
- Forms on low volume.
- Lacks confirmation.
Examples of False Signals:
- The second candle forms but the market resumes its uptrend the next day.
- Pattern forms at minor resistance rather than major swing high.
How to Avoid Traps:
- Always wait for confirmation.
- Use confluence with resistance, volume, and momentum indicators.
Best Timeframes and Markets to Use This Pattern
- Best Timeframes: Daily, 4-hour, and weekly charts are most reliable.
- Markets: Effective in equities, forex, crypto, and commodities.
- Trader Level: Suitable for all levels, especially swing and position traders.
Tips to Enhance Accuracy
- Combine with trendline breaks or resistance rejection.
- Use volume confirmation.
- Look for confluence with MACD or RSI divergence.
- Avoid using this pattern alone in range-bound markets.
Real Trade Example
A forex trader spots Bearish Harami on EUR/USD daily chart. Trend has been bullish. After the Harami forms, the next candle breaks lower. Entry is placed just below. Stop is above the high. RSI is overbought, confirming the setup. Trade hits target at prior support for a 1:2.5 reward.
Conclusion
The Bearish Harami candlestick pattern may be understated, but its implications are far-reaching. It’s a classic sign of market hesitation and a potential shift from bullish to bearish sentiment. For traders looking to protect gains or find shorting opportunities, this pattern can serve as an early clue to act before a major reversal begins.
Of course, no single pattern should be used in isolation. But when the Bearish Harami shows up near resistance or is supported by declining volume and confirmation indicators, it can become a strong signal to tighten stops or consider bearish positions. It’s quiet, but when you learn to read it—it speaks volumes.
Also Read: Evening Star Candlestick Pattern
Follow us on X