Introduction
The bearish engulfing candlestick pattern is a powerful two-candle formation that often appears at the end of an uptrend, signaling a potential shift from bullish momentum to bearish control.
Traders rely on this pattern to anticipate price drops and capitalize on early exit or short-selling opportunities. It’s called “engulfing” because the second candle completely wraps around the body of the previous bullish candle, visually confirming a surge in selling pressure. In this guide, we’ll explore the structure, market psychology, and trading strategies behind this critical bearish reversal pattern.
What is the Bearish Engulfing Candlestick?
The Bearish Engulfing candlestick pattern involves two candles and occurs at the peak of an uptrend. It indicates a possible reversal from bullish to bearish momentum.
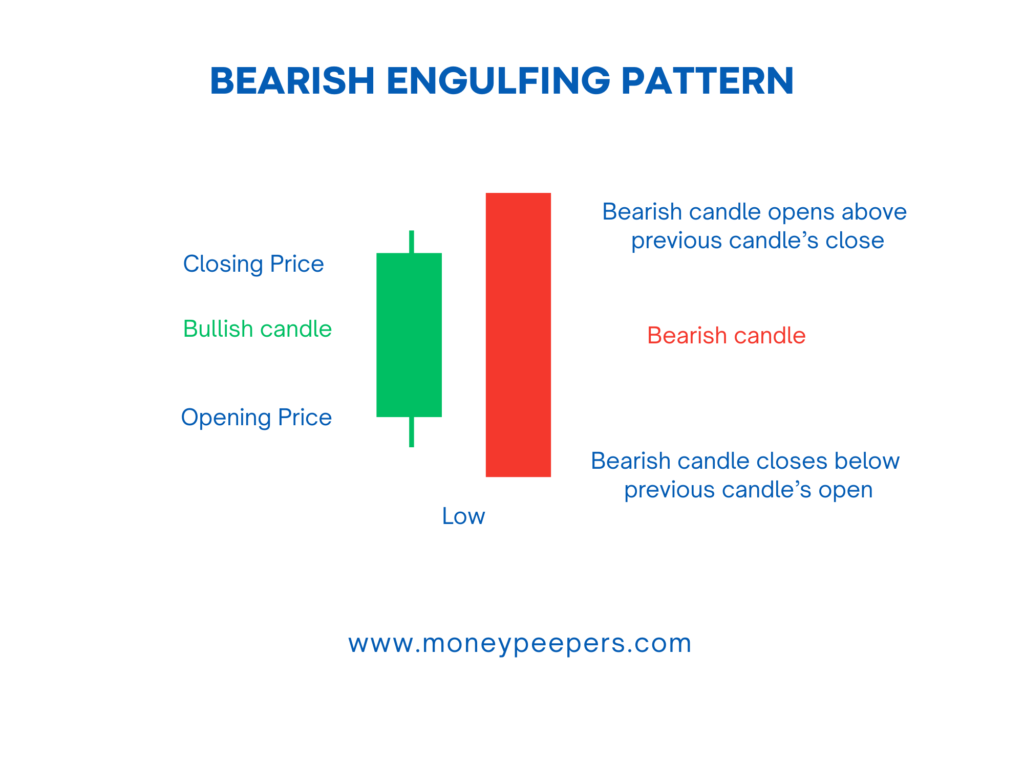
Visual Description and Components:
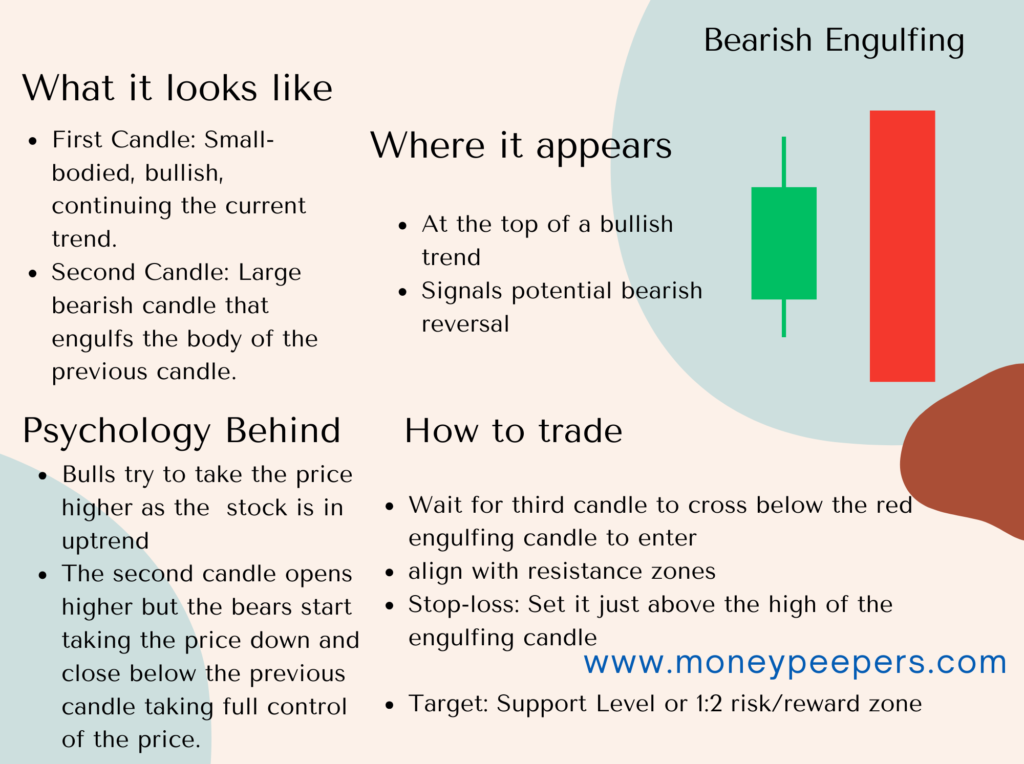
- First Candle (Bullish): A relatively smaller bullish candle (typically green or white).
- Second Candle (Bearish): A larger bearish candle (red or black) whose body completely engulfs the previous bullish candle.
The pattern clearly shows that sellers have aggressively entered the market, overtaking buyers and shifting market sentiment from bullish to bearish. It serves as a critical warning for traders that prices may soon decline.
Formation of Bearish Engulfing candlestick & Market Psychology Behind
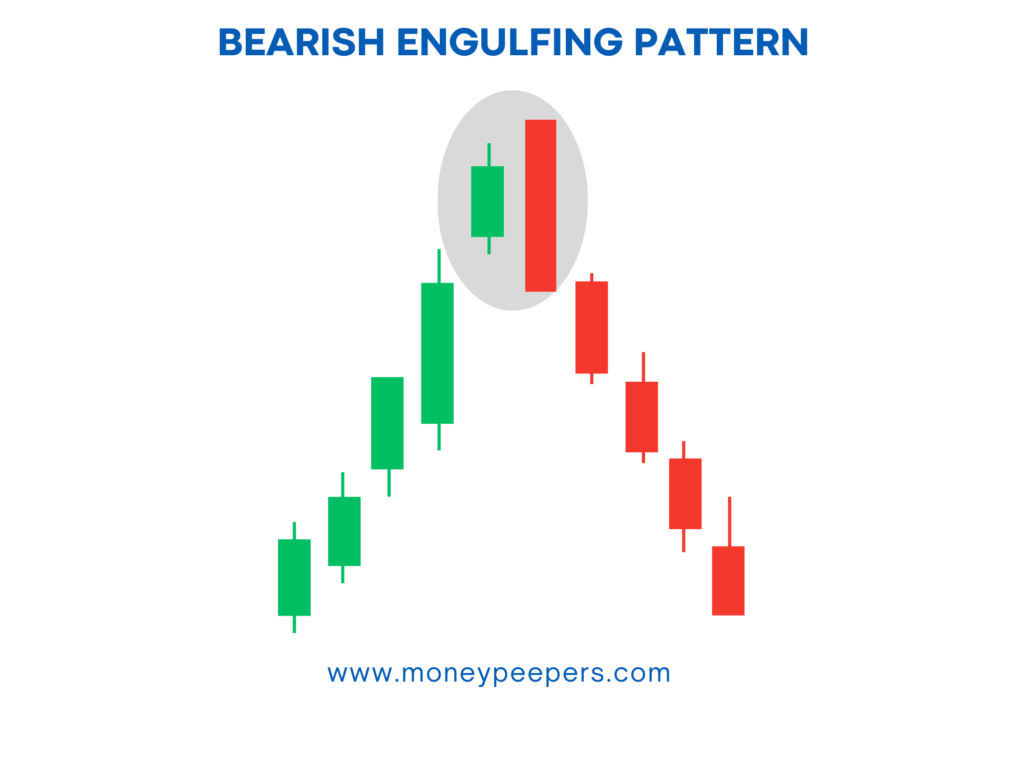
The Bearish Engulfing candlestick pattern forms after a sustained upward move where bullish sentiment has prevailed. Initially, optimism continues as buyers push prices higher, as depicted by the first candle. However, market dynamics change rapidly during the next session, with sellers forcefully entering the market and pushing prices sharply lower, creating a bearish candle that completely covers the previous bullish candle.
This rapid shift illustrates a psychological change. The buyers who previously dominated become uncertain, and sellers take advantage of this uncertainty to drive prices down, signaling the potential start of a bearish trend.
Real-world Example:
Imagine a stock that has enjoyed a steady rise due to positive news and strong earnings reports. Suddenly, negative market conditions or unexpected unfavorable news emerge, causing immediate concern among investors. Sellers quickly overwhelm buyers, forming a large bearish candle that engulfs the previous day’s bullish candle, creating the Bearish Engulfing candlestick pattern and signaling an upcoming bearish reversal.
Key Identification Criteria
For accurate identification of the Bearish Engulfing candlestick pattern, look for these critical characteristics:
- Formation after a defined uptrend: Essential to validate the pattern.
- Second bearish candle completely engulfs the first bullish candle’s body.
- Volume Spike: Higher-than-average volume on the bearish candle reinforces the signal.
- Clear Shift in Momentum: Evident loss of bullish momentum and the emergence of strong bearish activity.
Comparatively, this pattern differs significantly from others, such as the Shooting Star, which is a single-candle bearish reversal pattern.
How to Confirm the Pattern
Confirmation greatly enhances the reliability of the Bearish Engulfing pattern:
- Subsequent bearish candle: A strong follow-up bearish candle closing below the low of the engulfing candle confirms the reversal.
- Technical Indicators: Use indicators like RSI bearish divergence, MACD bearish crossovers, increased volume, or moving average breakdowns to further confirm the pattern.
For example, a bearish candle following the Bearish Engulfing pattern with significantly higher volume provides stronger confirmation, signaling traders to confidently enter short positions.
Trading Strategy Using Bearish Engulfing Candlestick
A practical trading strategy involves clear entry points, strategic stop-loss placement, and profit targets:
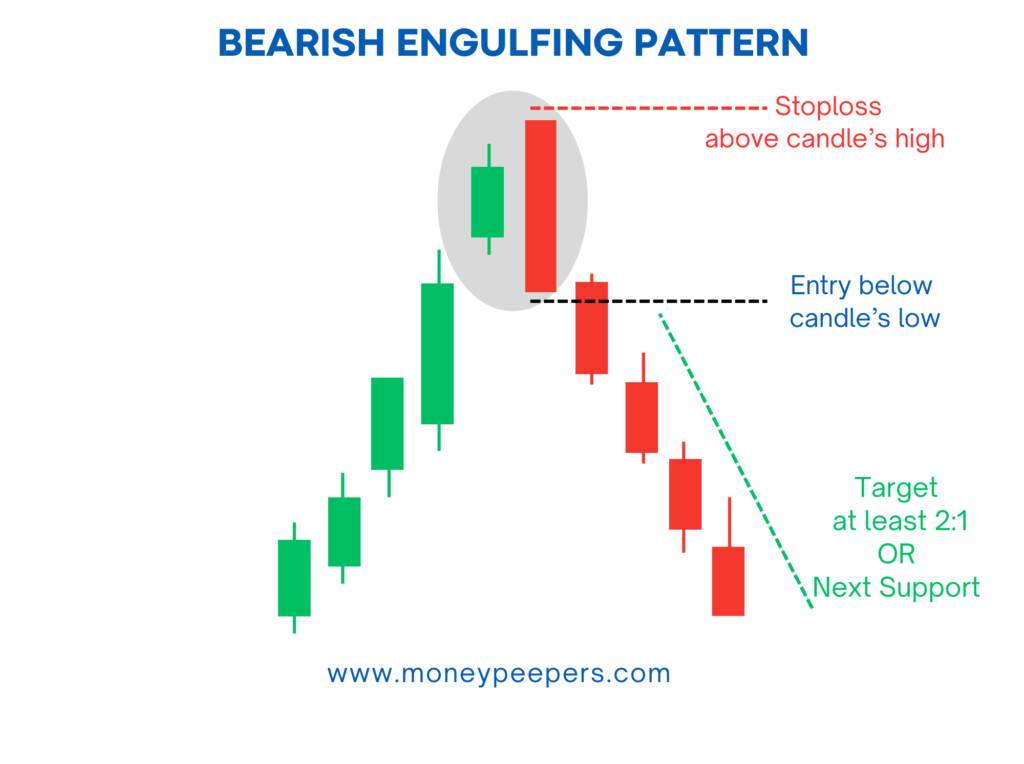
Entry Point:
Initiate a short position once the subsequent candle confirms bearish momentum by closing below the low of the Bearish Engulfing candle.
Stop-loss Placement:
- Conservative: Set above the high of the Bearish Engulfing candle.
- Aggressive: Place near the midpoint of the engulfing bearish candle.
Target/Exit Strategies:
Aim for previous support levels, Fibonacci retracement targets, or maintain a minimum risk-reward ratio of 1:2 to maximize profitability.
Position Sizing Tips:
Adjust position sizes according to personal risk management strategies, considering account size and individual risk tolerance.
Chart Examples
Consider a real-world scenario with Bitcoin in an uptrend. A Bearish Engulfing pattern forms at a key resistance level. Confirmation follows with another bearish candle. Traders enter short positions, placing a stop-loss just above the engulfing candle’s high and targeting support levels for profit, effectively using the pattern for a profitable trade.
When the Pattern Fails (Limitations & False Signals)
Despite its usefulness, the Bearish Engulfing pattern may occasionally provide false signals:
- Lack of Strong Confirmation: A weak or no follow-up bearish candle may indicate a false signal.
- Insufficient Volume: Low trading volume can result in reduced reliability of the bearish signal.
Tips to Reduce False Signals:
- Always seek robust confirmation.
- Integrate the pattern with other technical indicators.
- Avoid trading solely on this pattern during uncertain market conditions.
Best Timeframes and Markets to Use This Pattern
- Timeframes: Highly effective across multiple timeframes, suitable for intraday, swing, or positional traders.
- Markets: Reliable in stocks, cryptocurrencies, forex, and commodities, particularly in markets with distinct uptrends.
- Trader Suitability: Both beginners and experienced traders can effectively use this pattern, provided they apply appropriate confirmations and risk management.
Tips to Enhance Accuracy
To improve the pattern’s accuracy, traders should:
- Use trendlines, support/resistance levels, and volume analysis.
- Combine the Bearish Engulfing pattern with RSI, MACD, or moving averages.
- Avoid trading during sideways or low-volume market conditions to minimize false signals.
Real Trading Example (Optional Case Study)
Imagine trading Tesla (TSLA) stock, which experienced a prolonged bullish run. A clear Bearish Engulfing candlestick pattern appears near an all-time high. Upon receiving confirmation with another bearish candle and rising volume, traders enter short positions, placing their stop-loss above the high of the engulfing candle and targeting the next significant support level, resulting in a profitable trade.
Conclusion
The bearish engulfing candlestick isn’t just another chart pattern—it’s a clear message from the market that sellers are stepping in with strength. When this pattern forms near key resistance levels or is supported by declining volume trends, it often leads to meaningful price reversals.
While it’s a strong standalone indicator, combining it with confirmation tools like RSI, moving averages, or trendlines can enhance accuracy. Whether you’re a beginner or a seasoned trader, the bearish engulfing pattern should be part of your reversal detection toolkit, helping you make smarter, more timely decisions in volatile markets.
Read Also : Bullish Engulfing Candlestick
Follow us at X