Candlestick patterns are incredibly valuable for traders. They provide visual clues about market sentiment and help predict future price movements. Among these patterns, the “Hammer candlestick pattern” is a widely recognized bullish reversal signal. In this simple yet comprehensive guide, we’ll explore what a Hammer candlestick is, how it forms, the psychology behind it, practical strategies for trading, and common pitfalls to avoid.
What Exactly Is a Hammer Candlestick?
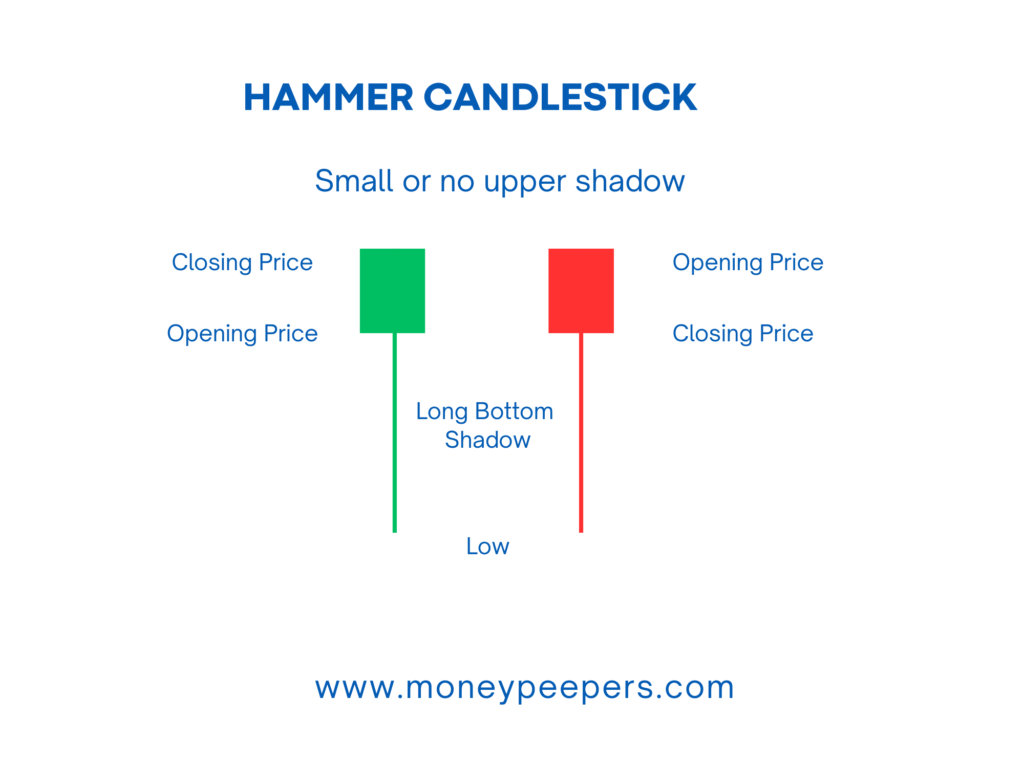
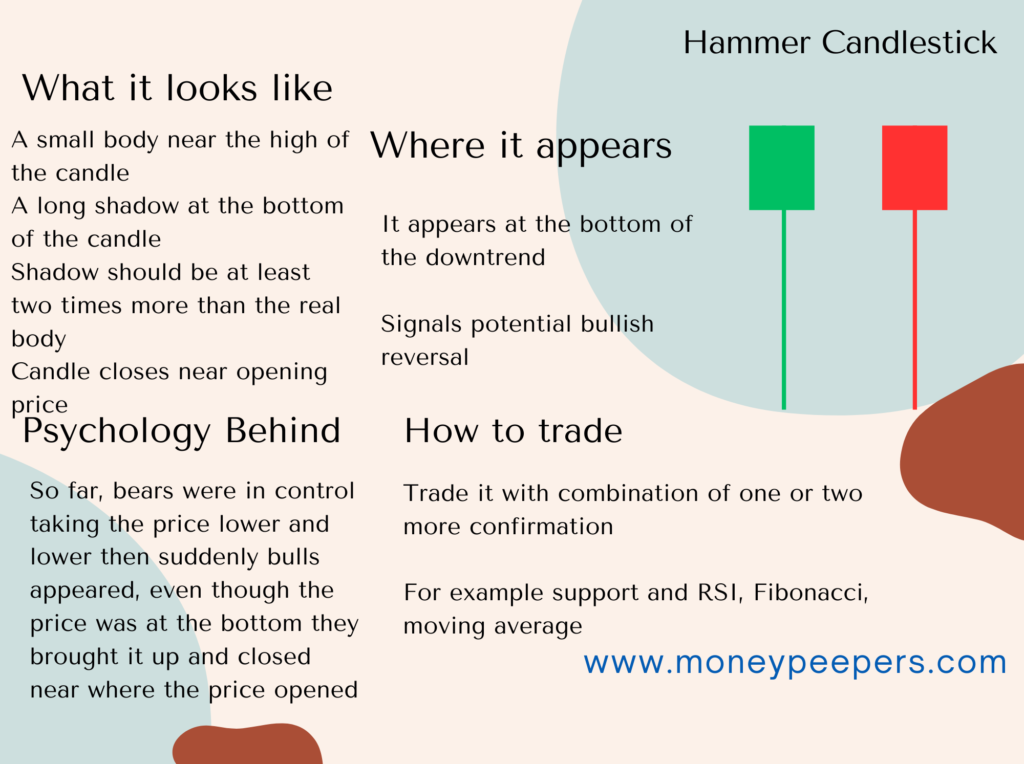
A Hammer candlestick pattern is a bullish pattern that typically appears after a downtrend. It signals that sellers are losing control and buyers are stepping in. Visually, the Hammer looks just like its name—a small body at the top with a long lower tail.
To qualify as a Hammer:
- The lower tail (shadow) should be at least twice the length of the real body.
- The body can be bullish (green or white) or bearish (red or black), though a bullish body adds strength to the signal.
- There should be little to no upper shadow.
This shape indicates strong buyer activity pushing prices back up after initially dropping sharply.
Breaking Down the Hammer: How It Forms
For a Hammer candlestick to be valid, certain conditions need to align:
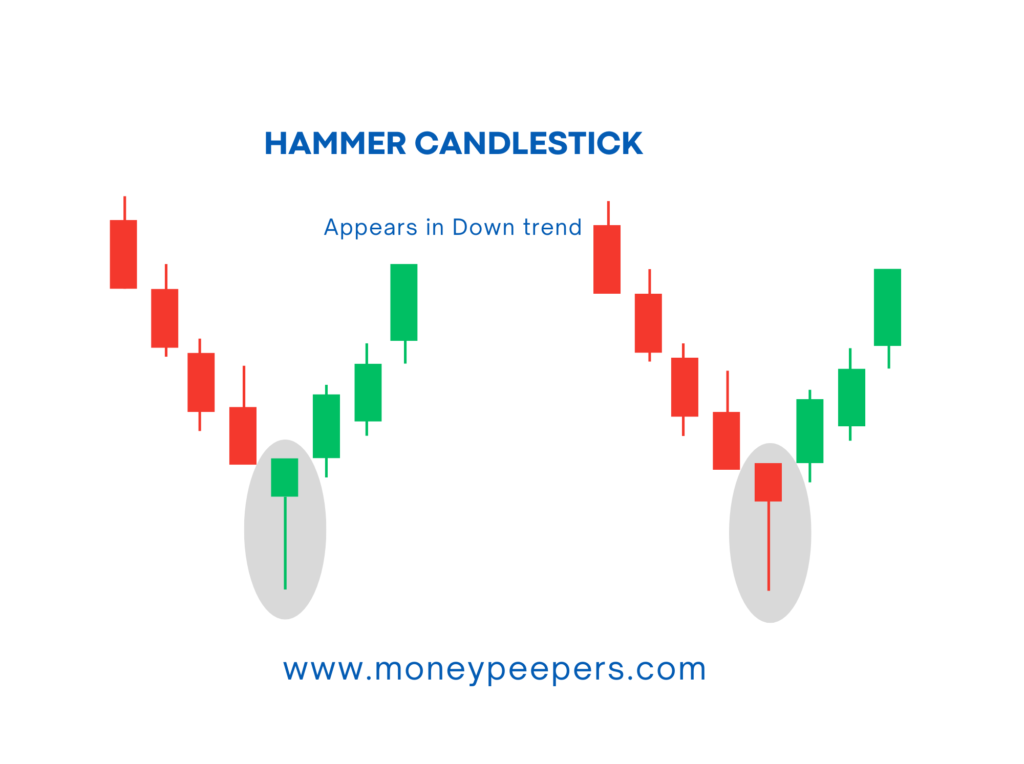
- Appears After a Downtrend: A Hammer should follow a clear downward move. The longer and stronger the prior downtrend, the more significant the reversal signal.
- Small Real Body: Positioned at the top of the candlestick, indicating that prices closed near the day’s high.
- Long Lower Shadow: Demonstrates substantial buying activity after a sharp initial drop.
- Minimal Upper Shadow: Indicates low selling pressure at higher prices during that trading session.
When these criteria are met, traders often anticipate a trend reversal from bearish to bullish.
The Psychology Behind the Hammer
To really understand why the Hammer is powerful, it’s important to grasp the market psychology behind it. Initially, the market opens and sellers dominate, pushing prices down sharply. However, as prices reach lower levels, buyers begin to see value and aggressively enter the market.
This buying pressure pushes prices back near the opening price, creating the long lower shadow. This shows that sellers couldn’t maintain control, signaling their weakening influence. Traders interpret this as an early sign that a bullish reversal might be on the way.
Practical Tips for Trading the Hammer Candlestick
Here’s how you can effectively trade using the Hammer candlestick pattern:
Step-by-Step Entry and Confirmation
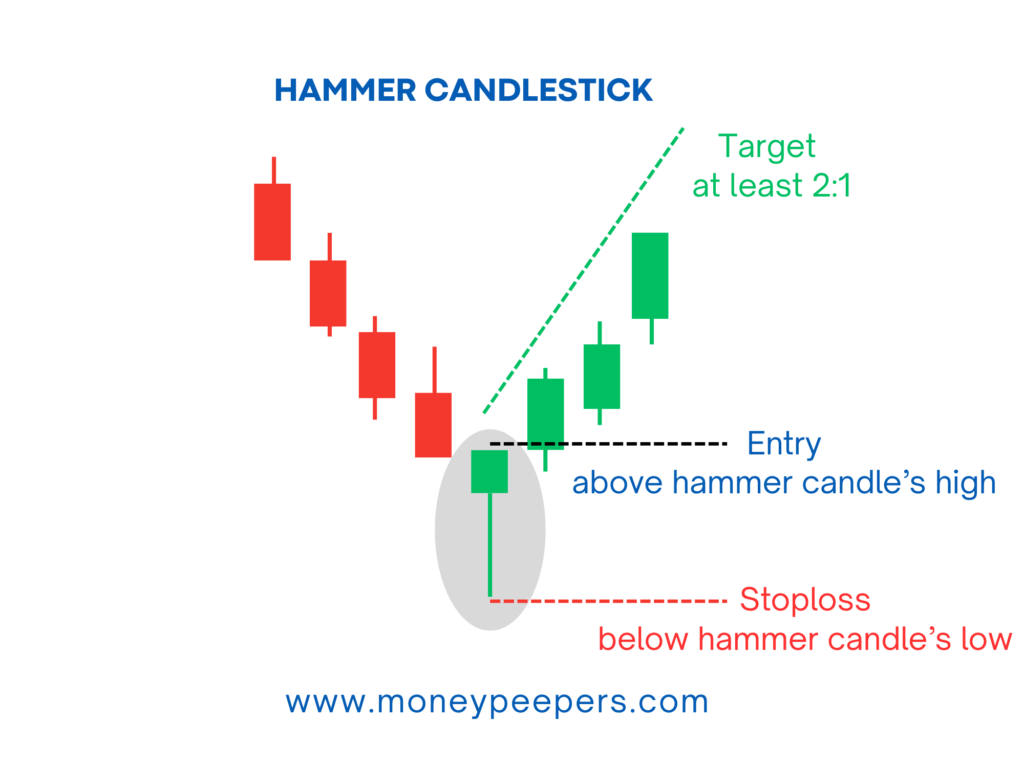
- Wait for the Next Candle: Always confirm the signal. If the candle following a Hammer closes higher than the Hammer’s high, it’s a strong confirmation.
- Combine with Support Levels: A Hammer forming near key support levels, moving averages, or Fibonacci retracement areas significantly strengthens the trade setup.
Risk Management: Setting Stops and Targets
- Stop-Loss: Place a stop-loss just below the Hammer’s low. This minimizes potential losses if the trade doesn’t work out.
- Profit Targets: Aim for resistance levels or use Fibonacci zones as targets. A risk-to-reward ratio of at least 1:2 is advisable.
Real Example Scenario:
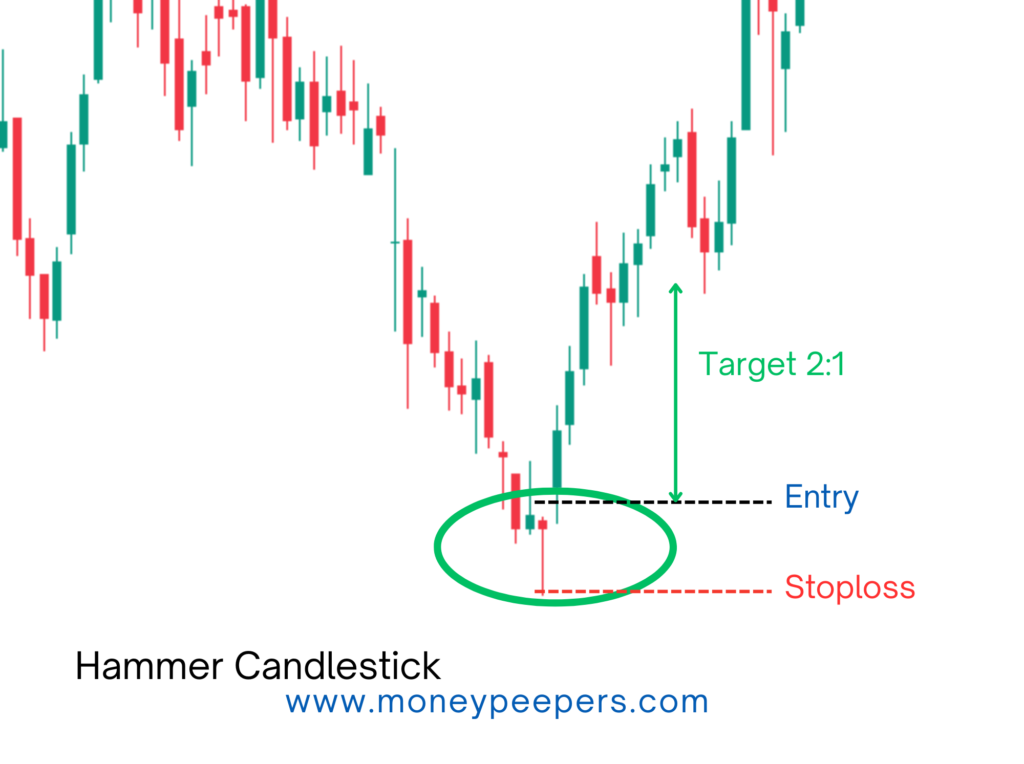
When analyzing a stock that has been in a prolonged downtrend, it can sometimes reach a key support level on a higher timeframe. At this point, a Hammer candlestick pattern might emerge—a significant indicator in technical analysis. This pattern reflects a shift in market sentiment: up until this point, bears dominated the market, while bulls remained on the sidelines. However, as soon as the stock hits this support level, buyers (bulls) make a sudden and noticeable comeback.
The Hammer candlestick itself tells a story. Initially, sellers (bears) aggressively pushed the price downward, attempting to break through the support level. But then, buyers stepped in with determination, fighting back and pushing the price upward, ultimately bringing it close to where the candle initially opened. This price action forms a candlestick with a long lower shadow and a small real body—resembling the shape of a hammer.
A Hammer candlestick at a key support level typically signals a potential buying opportunity. However, it’s important to wait for confirmation before entering a trade. If the next candle closes above the high of the Hammer, this can be considered confirmation. For additional reliability, one can check other factors like Fibonacci retracement levels or seek two to three corroborating signals before proceeding.
When entering the trade, place a stop loss at the low of the Hammer candle to manage risk effectively. The target should be at least a 2:1 risk-to-reward ratio, with the possibility of aiming for higher ratios like 3:1 or 4:1, depending on the market conditions and analysis.
Avoiding Common Pitfalls and False Signals
Even though the Hammer candlestick pattern is a powerful signal, it has its limitations:
- Market Context Matters: A Hammer in a sideways or upward market isn’t reliable.
- Check Trading Volume: Higher volume on the Hammer candle increases its validity. Low-volume Hammers can sometimes mislead traders.
- Never Trade Solely on the Hammer: Combine it with other technical tools like RSI, MACD, or volume indicators to confirm the reversal.
Being aware of these pitfalls helps traders focus on high-quality signals and improves their success rate.
Boosting Hammer Candlestick Trades with Other Indicators
Enhance your trading accuracy by pairing the Hammer candlestick pattern with additional indicators:
- Oscillator Divergence (RSI or MACD): A bullish divergence between price and oscillators strongly confirms a reversal.
- Moving Averages: A Hammer near important moving averages (like the 50-day or 200-day) adds reliability to the trade.
- Trendline Breakouts: A Hammer appearing around a trendline breakout provides a compelling entry point.
Final Thoughts: Making the Hammer Work for You
The Hammer candlestick pattern is a valuable tool for identifying potential bullish reversals. By recognizing its formation conditions, understanding market psychology, and applying proper trading strategies, traders can significantly enhance their decision-making.
Always confirm Hammer signals with additional indicators and market context to improve your trading outcomes. With practice, the Hammer candlestick can become an essential part of your trading toolkit, guiding you toward profitable trades.
Also Read : Inverted Hammer Candlestick : Powerful Bullish Reversal Pattern