Introduction
Among the many candlestick patterns traders rely on to gauge shifts in market sentiment, the Hanging Man Candlestick stands as a subtle but serious warning sign. It might look like just another candle on the chart, but its appearance—especially after a strong uptrend—can be a silent alarm of potential trouble ahead.
This single-candle formation doesn’t scream reversal. Instead, it whispers caution. The Hanging Man pattern is easy to overlook, yet when paired with the right confirmation, it has the power to signal the beginning of a bearish move. In this article, we’ll dive deep into what the Hanging Man candlestick is, how it forms, what it reveals about market psychology, and how traders can use it to make smarter, more strategic decisions.
What is the Hanging Man Candlestick?
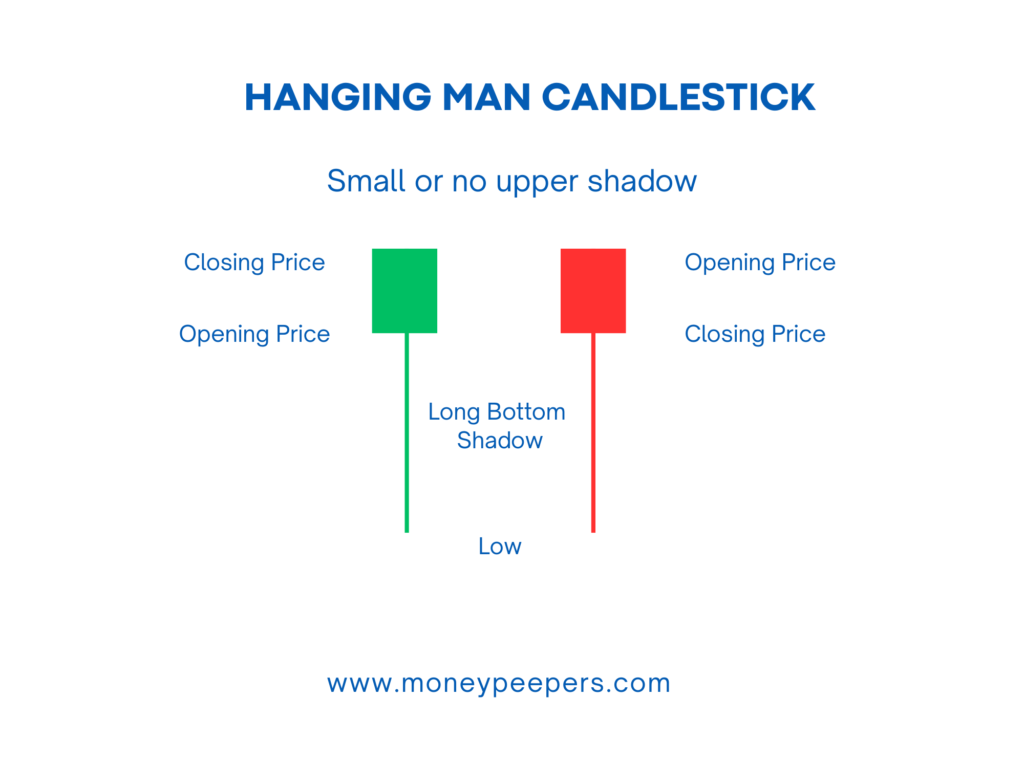
The Hanging Man candlestick is characterized by a distinct appearance:
- Body: Typically small and near the top of the trading range. It can be bullish (green/white) or bearish (red/black).
- Upper Shadow: Very minimal or non-existent.
- Lower Shadow: Significantly long, at least twice the length of the real body.
This structure visually resembles a man hanging, hence the name. Despite its grim moniker, it’s merely symbolic and essential in technical analysis, signaling potential bearish reversals after an uptrend.
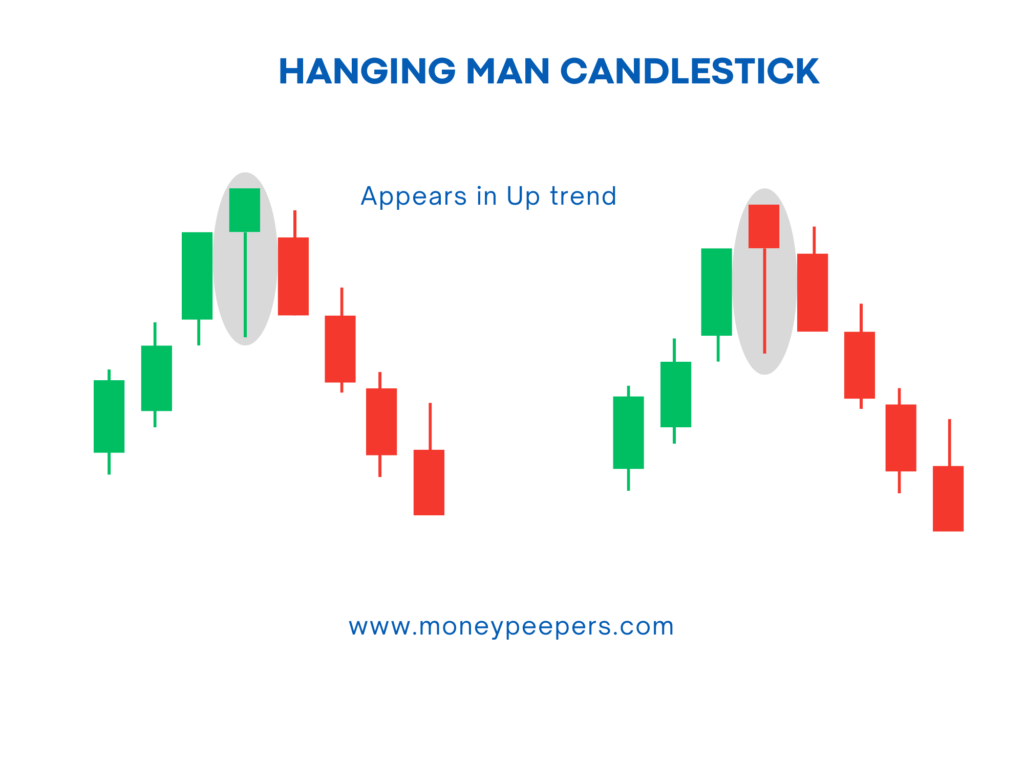
The Hanging Man pattern primarily signals a bearish reversal. Its appearance after a strong upward move suggests that bullish traders have lost their grip, and selling pressure is becoming prevalent.
Formation & Market Psychology Behind It
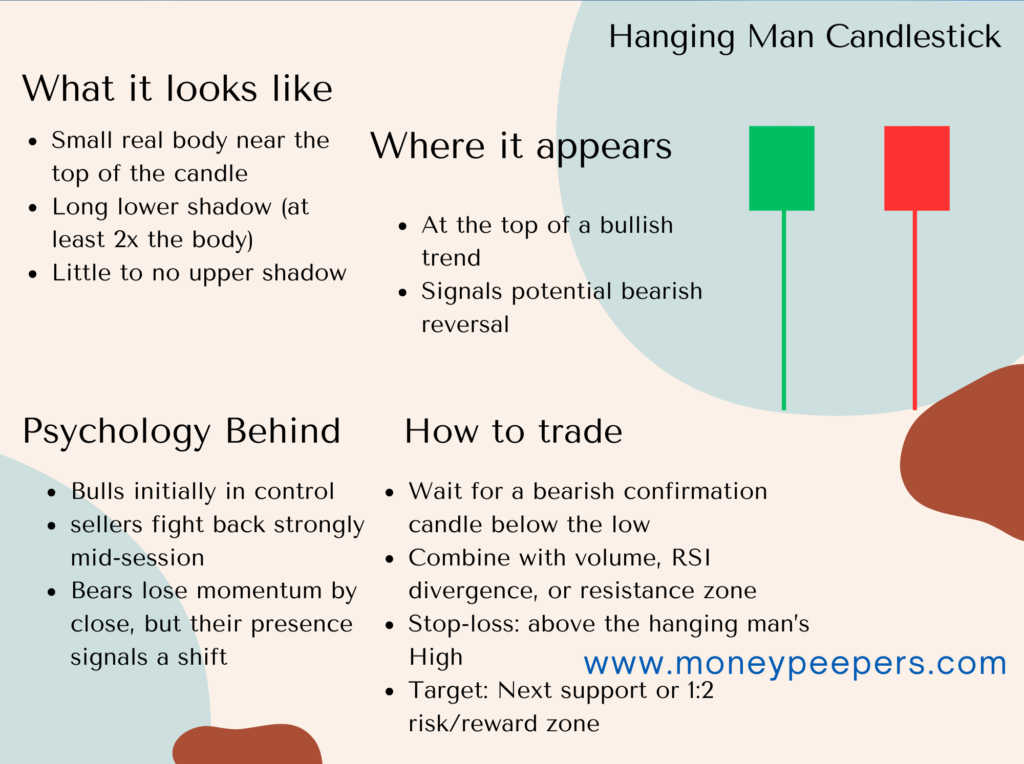
The Hanging Man pattern emerges when the market opens near the high of the day following a substantial bullish run. Initially, prices may decline significantly as sellers temporarily take control, driving prices down sharply. However, before the day closes, buying pressure returns, pushing the price back near the opening level.
Psychologically, this signifies a critical battle between bulls and bears. While bulls manage to push the price back up, the long lower shadow clearly indicates that significant selling pressure exists at higher price levels. This scenario creates uncertainty among bullish traders, who begin to question the sustainability of the current trend.
How Hanging Man Candlestick pattern forms
Imagine a stock experiencing an extended bullish trend. Traders aggressively buy, driving prices upwards. One day, prices open high but suddenly drop drastically due to significant selling pressure. By the session’s close, prices recover to near the opening price, creating a small body with a long lower wick. This scenario visually confirms a Hanging Man, suggesting the bulls are losing control.
Key Identification Criteria
For effective identification, traders should focus on these essential criteria:
- Appears after a clear uptrend.
- Small real body near the candle’s top, color unimportant.
- Long lower shadow (at least twice the body length).
- Minimal or no upper shadow.
It’s also essential to differentiate the Hanging Man from the Hammer pattern, which appears similar but occurs after a downtrend, signaling a bullish reversal rather than bearish.
How to Confirm the Hanging Man Candlestick Pattern
The Hanging Man requires confirmation for effective trading:
- Look for a subsequent bearish candle that closes below the low of the Hanging Man.
- Increased volume on the bearish confirmation candle reinforces the bearish reversal signal.
- Use technical indicators like RSI, MACD, or moving averages to confirm weakening momentum.
For instance, a bearish candle with high trading volume immediately following a Hanging Man strengthens the pattern’s validity and offers greater confidence in initiating a bearish trade.
Trading Strategy Using the Hanging Man Candlestick
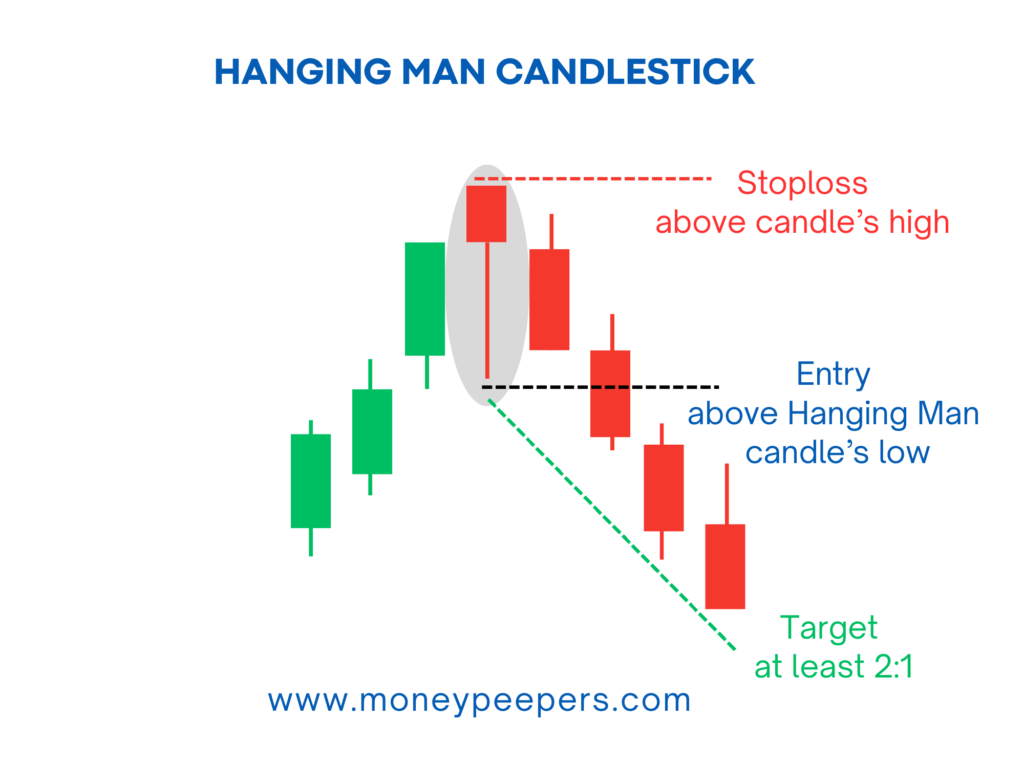
Here’s a practical trading strategy:
- Entry Point: Enter a short position when the following candle closes below the Hanging Man’s low.
- Stop-Loss: Place a stop-loss order slightly above the high of the Hanging Man candle to minimize potential losses.
- Target/Exit Strategies: Aim for support levels, Fibonacci retracement zones, or maintain at least a 1:2 risk-reward ratio.
- Position Sizing: Adjust your position size according to your risk tolerance and account size, ensuring responsible risk management.
Chart Examples
Let’s consider a practical example from forex trading:
In the EUR/USD currency pair, an extended bullish rally ends with a Hanging Man candle. The next candle confirms the reversal by closing below the Hanging Man’s low. Traders enter short positions, set stop-loss orders slightly above the pattern’s high, and target the nearest support level, thus capitalizing effectively on the reversal.
When the Pattern Fails (Limitations & False Signals)
Despite its efficacy, the Hanging Man Candlestick can sometimes yield false signals:
- False signals often occur during strong, persistent uptrends, where momentum quickly overrides brief selling pressure.
- Low trading volume on confirmation signals can diminish reliability.
- Traders should avoid acting solely on the Hanging Man pattern without additional confirming indicators or signals.
To minimize false signals, traders should use supplementary analysis tools and confirmation signals for better reliability.
Best Timeframes and Markets to Use This Pattern
- Timeframes: The Hanging Man works well across multiple timeframes, from intraday (15-min, hourly) to daily or weekly charts. Swing traders and positional traders frequently benefit the most.
- Markets: Effective in stocks, forex, cryptocurrencies, and commodities, particularly in liquid markets with clearly defined trends.
- Suitability: Beginners can successfully apply this pattern with adequate practice and supplementary confirmation tools.
Tips to Enhance Accuracy
Enhance the effectiveness of the Hanging Man by:
- Combining it with trendlines and support/resistance levels.
- Confirming with volume analysis and momentum indicators.
- Avoiding reliance solely on the pattern, particularly in low-volume or choppy markets.
Conclusion
The Hanging Man candlestick pattern may seem insignificant at first glance, but its implications in the context of an uptrend can be quite powerful. It reflects a shift in control—where buyers begin to lose grip, and sellers start testing the waters. Recognizing this pattern in real-time, especially when backed by volume spikes or additional bearish signals, can give traders the edge to exit before a reversal takes full shape.
However, like any tool in technical analysis, the Hanging Man works best when combined with other indicators and confirmation strategies. Never trade a single candle in isolation—think of it as a clue, not a conclusion. Stay observant, stay analytical, and most importantly, stay disciplined. That’s how patterns like the Hanging Man transform from theory into profitable action.
Also Read: Shooting Star Candlestick: A Powerful Signal for Bearish Reversals